

Conductometry - Pharmaceutical Analysis 1 B. Pharma 1st semester
Conductometry
Contents
• Conductometry
• Principle involved
• Measurement of conductivity
• Pros and cons of conductometric titrations
• Precautions to be taken
• Procedure
• Comparison of potentiometry vs conductometry
• Applications
Objectives
By the end of this session, students will be able to:
• Define conductometry
• Define and explain the principle involved in conductometric titrations
• Discuss the pros and cons Conductometry
• Explain precautions to be taken for conductometric titrations
• Brief the applications of conductometric titrations
Conductometry
• Measurement of conductivity of a solution
• Due to mobility of cations and anions towards respective electrodes
• Conductivity (C) is inversely proportional to resistance (R) of a solution
C = 1/R
• Unit of conductivity is mhos or ohms-1
• Conductivity of a solution depends upon-
o Number of ions (concentration)
o Charge of ions
o Size of ions
o Temperature
• Resistance of a solution is given by
R = E/I
Where E = potential difference
I = current which flows through
Unit of resistance (R) is ohms
Potential difference (E) is volts
Current (I) is amperes
• Resistance of a solution depends upon length (l) and cross resistance (a) of the conductor through which conductivity takes place
R = ρl/a
• ρ is specific resistance
• Specific resistance (ρ) is the resistance offered by a substance of 1cm length and 1 sq.cm surface area, Unit of measurement is ohm cm
• Specific conductivity (kv) is the conductivity offered by a substance of 1cm length and 1 sq.cm surface area, Unit of measurement is mhos cm-1
• Equivalent conductivity (λv) is the conductivity of a solution containing equivalent weight of the solute between electrodes 1 cm and 1 sq.cm, Unit of measurement is mhos cm-1
• Molar conductivity (μv) is the conductivity of a solution containing molecular weight of the solute between electrodes 1 cm apart and 1 sq.cm surface area
• Molar conductivity = specific conductivity x volume of solution containing one molecular weight of the electrolyte
Measurement of Conductivity
• Conductivity may be measured by applying an alternating electrical current (I) to two electrodes immersed in a solution and measuring the resulting voltage (V)
• Cations migrate to the negative electrode, the anions to the positive electrode and the solution acts as an electrical conductor

• Conductivity is typically measured in aqueous solutions of electrolytes/ ions
• For the actual determination of conductivity, we need
• Wheatstone bridge circuit and Conductivity cell
• Conductivity cells are of different types
• Made up of platinum and coated with platinum black
• If the electrodes are old, platinisation can be done be done by using 3% solution of chloroplatinic acid and 0.02-0.03% of lead acetate to get uniform coating
• Different electrodes used depends upon the conductivity of the solution is high or low
• Commonly used are platinum electrodes
• Wheatstone bridge circuit consists of
• Standard resistance in one of its arms
• Other arm contains a conductivity cell (platinum electrode) dipped into the solution whose conductivity is to be determined
• Galvanometer shows the deflection of standard resistance with that of resistance of unknown solution
• R2/R1 = Resistance of BC/ Resistance of BA
• R2 is resistance of unknown solution
• R1 is standard resistance
• R2 = BC/BA x R1
• Conductivity of unknown solution = BA/BC x R1
• Observed conductivity is not always the specific conductivity
• Dimensions of the platinum electrode of various manufacturers are not same
• Distance between the electrodes and surface area of electrodes varies
• Value of cell constant to be calculated
• Cell constant (x) = l/a
• Where l = distance between electrodes
• a = area of electrode
• Relation between specific conductivity and observed conductivity can be derived as R = ρl/a
• R/ρ = l/a
• x = R/ρ = 1/observed conductivity / 1/specific conductivity
• x = R/ρ = specific conductivity / observed conductivity
• Specific conductivity = x * observed conductivity
• Specific conductivity = cell constant x observed conductivity
• Determination of cell constant
• Cell constant of a conductivity cell is determined by measuring the conductivity of a known strength of potassium chloride at specific temperature
• Conductivity of 0.02 KCl at 25 0C, cell constant is
• 2765/ observed conductivity of 0.02 KCl at 25 0C in µmhos
• Conductivity of 0.01 KCl at 25 0C, cell constant is
• 1221/ observed conductivity of 0.02 KCl at 25 0C in µmhos
Conductometric Titrations
• End point determination by conductivity measurements
• Conductivity solution depends on
• Change in number of ions
• Mobility of ions
• Graph of conductivity vs volume of titrant added
Pros
• Determination of specific conductivity is not required
• Not necessary to use conductivity water
• No indicator is required
• Titrations can be done with colored or dilute or turbid solutions
• Incompletion at end point doesn’t affect results as measurements before and after end point are sufficient
• End point is determined graphically, errors are minimized and can get accurate end point
• Cell constant need not be determined provided the same electrode is used throughout the experiment
• Temperature need not be known provided it is maintained constant throughout the titration
Apparatus required
• Titration vessel (beaker)
• Stirrer for mixing
• Automatic or manual burette to deliver titrant
• Conductivity meter with a conductivity cell (platinum electrode)
Procedure
• Conductivity is measured in millimhos or micromhos
• Titrant is added in small increments like 0.5 ml – 1.0 ml
• Solution is mixed properly and conductivity readings are taken
• Readings were taken before and after end point
• Graph is plotted- conductivity vs volume of titrant added
• Point of intersection is found
• Corresponds to end point or volume of titrant required to neutralize the reactants or sample present in titration vessel
Precautions to be taken
• Initial volume of titrating substance and final volume after titration are not same
• Conductivity measurements made during titration are subject to error
• Correction factor is included to know actual conductivity
• Actual conductivity = observed conductivity X (𝑖𝑛𝑖𝑡𝑖𝑎𝑙𝑣𝑜𝑙𝑢𝑚𝑒 + 𝑣𝑜𝑙.𝑜𝑓𝑡𝑖𝑡𝑟𝑎𝑛𝑡𝑎𝑑𝑑𝑒𝑑/𝑖𝑛𝑖𝑡𝑎𝑙𝑣𝑜𝑙𝑢𝑚𝑒)
• Temperature should be maintained constant
• Heat of neutralization may affect the temperature and it effects the conductivity of solution
Acid base Titrations
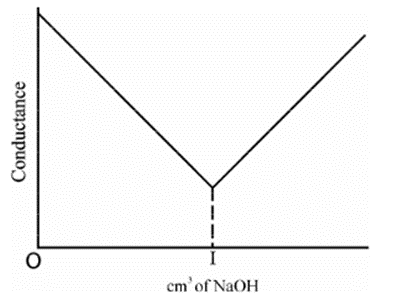
Strong acid vs Strong base
• HCl + NaOH àNaCl + H2O
• HCl in beaker as titrate- high conductivity
• Strong acid- dissociation is complete
• NaOH is added as titrant – conductivity gradually decreases after every addition
• After the end point, when all the H+ has reacted- addition of NaOH increases the concentration of OH- ions – conductivity starts increasing
• First part of curve shows steep fall in conductivity because of decrease in H+ ions
• Second part of curve shows gradual increase because of increase in OH- ions Strong Acid vs Weak Base
Strong Acid vs Weak Base
• HCl + NH4OH àNH4Cl + H2O
• HCl in beaker as titrate- high conductivity
• Strong acid- dissociation is complete
• NH4OH is added as titrant – conductivity gradually decreases after every addition
• After the end point, when all the H+ has reacted- addition of NH4OH doesn’t cause increase in the concentration of OH- ions
• Poor dissociation- conductivity remains constant
• First part of curve shows steep fall in conductivity because of decrease in H+ ions
• Second part of curve shows plateau

Weak Acid vs Strong Base
• CH3COOH + NaOH àCH3COONa + H2O
• CH3COOH in beaker as titrate- initial conductivity is low
• Weak acid- doesn’t dissociate into H+ ions
• NaOH is added as titrant – slight increase in conductivity till end point
• After the end point, addition of NaOH causes increase in the concentration of OH- ions
• Conductivity starts to increase steeply
• First part of curve shows gradual increase
• Second part of curve shows steep increase because of increase in OH- ions

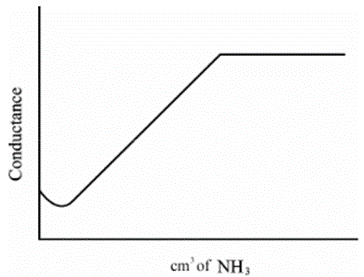
Weak Acid vs Weak Base
• CH3COOH + NH4OH àCH3COONH4 + H2O
• CH3COOH in beaker as titrate- initial conductivity is low
• Weak acid- doesn’t dissociate into H+ ions
• NH4OH is added as titrant – ammonium acetate salt has better conductivity gradually increases after every addition
• After the end point, when all the CH3COOH has reacted addition of NH4OH causes no increase in the conductivity
• Plateau is obtained
• First part of curve shows gradual increase in conductivity because of ammonium acetate salt
• Second part of curve shows plateau because or poor dissociation of NH4OH
Comparison
| | Potentiometric titration | Conductometric titration |
| Parameter measured | Potential in mv | Conductivity in mhos |
| Parameter not necessary | Potential of reference electrode | Cell constant |
| At end point | Rate of change of potential is maximum | Sharp change in conductivity occurs |
| End point determination | Normal curve, first derived curve, second derivative curve | End point shown by intersection of two lines |
| Strength of titrant | Same as that of titrate | 5 or 10 times stronger than titrate |
| Dependency | Temperature dependent | Temperature dependent |
Applications
• Solubility of sparingly soluble salts- silver chloride, barium sulfate, lead sulfate
• Ionic product of water
• Basicity of organic acids- number of carboxylic groups present in the molecule- tartaric acid, oxalic acid
• Purity of water- specific conductivity of pure water is 5 x 10⁻⁸ ohm-1 cm-1
• Quantitative analysis
• Salinity of sea water
• Equilibrium in ionic reactions- progress of ionic reactions can be determined
Summary
• Measurement of conductivity of a solution- Due to mobility of cations and anions towards respective electrodes
• Resistance of a solution depends upon length (l) and cross resistance (a) of the conductor through which conductivity takes place
• Conductivity may be measured by applying an alternating electrical current (I) to two electrodes immersed in a solution and measuring the resulting voltage (V)
• Cations migrate to the negative electrode, the anions to the positive electrode and the solution acts as an electrical conductor
• Observed conductivity is not always the specific conductivity
Conductivity solution depends on
• Change in number of ions
• Mobility of ions
• Graph of conductivity vs volume of titrant added
• Conductivity is measured in millimhos or micromhos
0 Comments: